Debugging on the Web
When we develop for Windows, we use a debugger. So why does so much of our web development follow the code refresh ”Did it work?” progression? All modern web browsers have some sort of web development tools. These can be used to check your CSS, manually manipulate Document Object Model (DOM) elements, and even debug your JavaScript.
Today we’ll focus on Google Chrome’s Developer Tools, IMHO the best-of-breed. You can access the inspector on any web page by right-clicking an element and selecting “Inspect Element” or by pressing F12. For this post, we’ll look at the W3Schools Intro to HTML5 page.
JavaScript Breakpoints
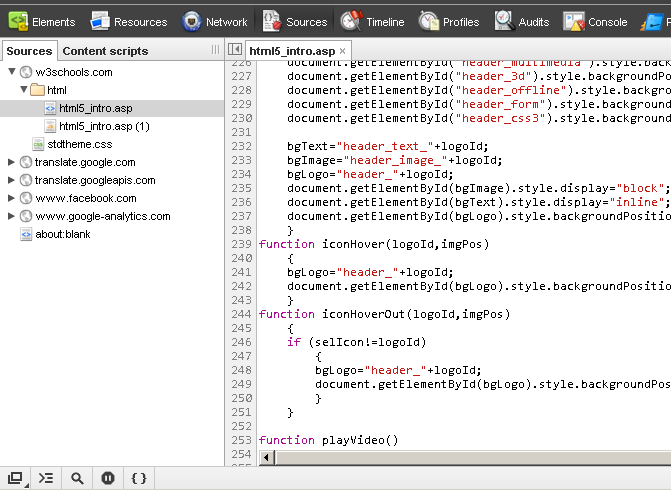
Open the inspector, click the Sources tab, expand w3schools.com and html, and click html5_intro.asp. You will see the JavaScript source on the page.
Let’s set a breakpoint in the iconHover function. Click line number “242” to the left to set the breakpoint. Now, hover over one of the small icons on the page and you should hit your breakpoint. Notice the “Paused in debugger” message on the disabled page.
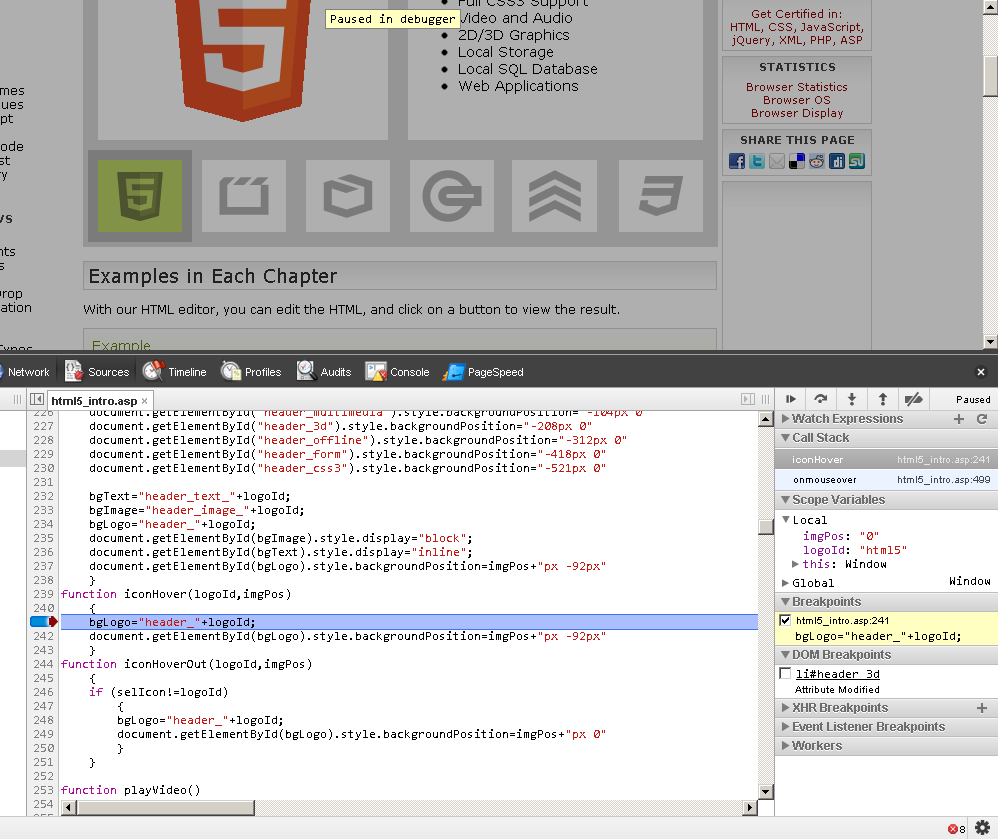
Many of your favorite debugging features are available, such as hovering over variables, locals, and call stack. “Step into”, “step out of”, “step over”, and “continue” are available at the top of the right window. Play around in here and see how it adjusts the “backgroundPosition” element of the current logo.
Break on DOM Manipulation
If you are manipulating the DOM and want to see why something is getting added twice or being added to the wrong spot, Chrome allows you to break on three DOM events:
- Subtree Modifications: Removing or adding child nodes.
- Attributes Modifications: Any changes to the attributes of the current node (style, class, etc.).
- Node Removal: Removing the element from the DOM.
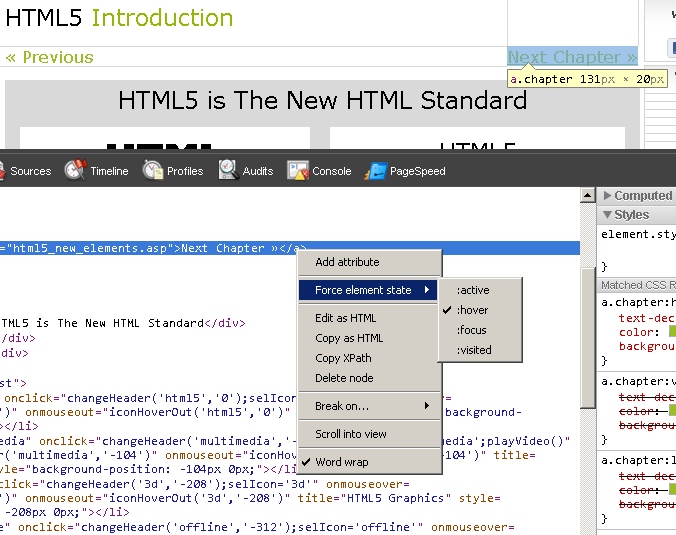
Right-click a small icon on the HTML5 page and select “Inspect Element”. In the Elements section of the developer tools, right-click that element and select “Break On…” and “Attributes Modifications”.
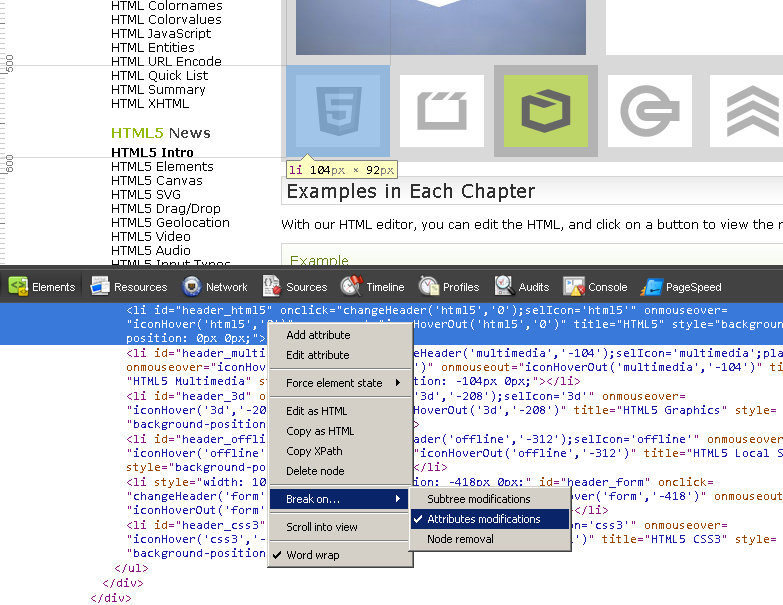
When you click that element, you will hit a breakpoint on the “backgroundPosition” attribute change for that element.
XHR Breakpoints
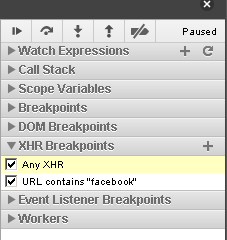
You can add breakpoints on XHR (XmlHttpRequest, think AJAX) with filters. In the Scripts pane, click the + button to add a breakpoint. Add a filter or press Enter to break on any XHR. Try adding a filter for “facebook” and reloading the page. You’ll notice that it breaks on a request to “https://fbstatic-a.akamaihd.net/”.
Set Object State
Have you ever tried to debug something that happens on a hover? As soon as you move the mouse off the element, the state is gone. Fortunately, Chrome lets you force the element into any state you choose. Right-click the “Next Chapter” link on the page and select “Inspect Element”. From the Elements tab, right-click the element, and select “Force element state” and “:hover”. Notice that the link is now underlined as if you were hovering over it. You can force the element to any combination of these four states:
- Active
- Hover
- Focus
- Visited
Hopefully this helps you debug and write better JavaScript. If you’re looking for some help brushing up on your JavaScript, check out js-assesment on github.