Visualizing Data in Angular Applications with Chart.js
Charting is something we often do in the software we develop. While it isn’t difficult, it can take more work than you might think. In this blog post, we will create some very simple charts using Chart.js.
Assuming we already have an Angular application, we can install Chart.js using npm.
npm install chart.js
Now let’s create a component in our angular application.
ng g component dashboard
Once we have a dashboard component, we need to create our charts. First, we will import our Chart package.
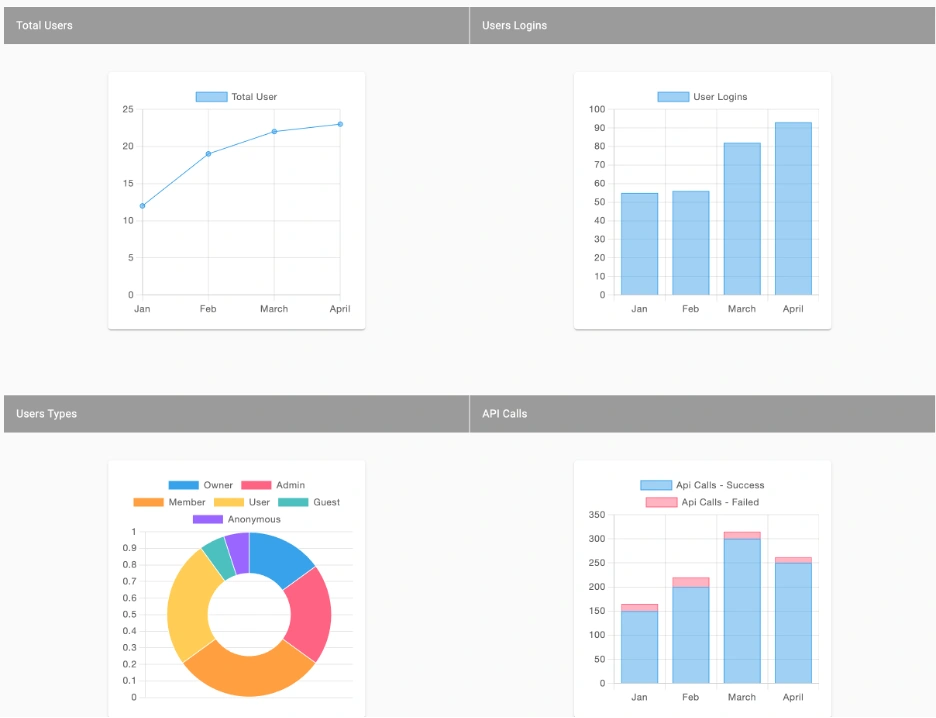
Now we need to create our chart configuration. For this example, I will make a line chart showing the number of total users over time.
In our ngOnInit, we need to create our chart using the chart configuration.
Then we need to create our chart on our dashboard.html file.
Now you should have a simple graph showing users over time. The links below contain a fuller example with four charts.
https://gist.github.com/chadmichel/b1342d11198b9498a23444f755ac113a
https://gist.github.com/chadmichel/2864b0d6d9d7b1034e9e2f2f7e2e59b1