Mapbox – Visualizing Workout Activities
Creating a custom map for your data has never been easier with tools such as Mapbox. Within minutes you can have your data uploaded and visualized in a stylized map ready to be consumed on the web or by a mobile app. Mapbox Studio is a one-stop shop for uploading data, creating a layer, styling your map, testing, and publishing.
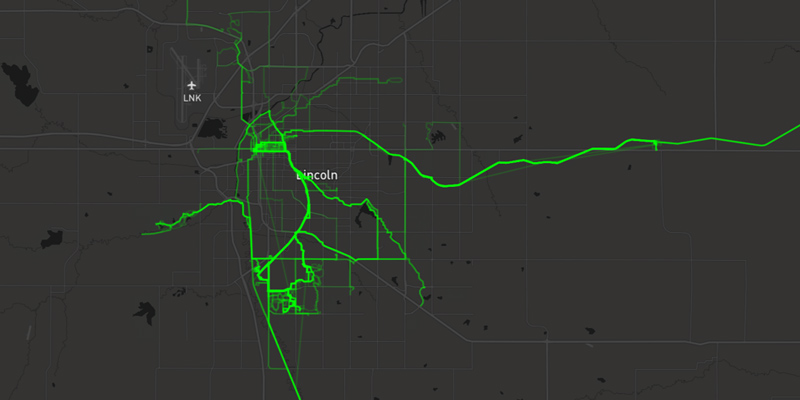
I’ll go through an example from start to finish to create your own heatmap-like visualization of data. In this example, I’ll be using my workout activities (specifically cycling) to create a heatmap of my rides.
1. Acquire the data you’d like to visualize. Many fitness tracking websites allow you to export your activities as .gpx files.
Mapbox accepts many different file types for tilesets, but we’re going to convert our gpx files into geojson because Mapbox allows geojson files up to 1 GB in size (instead of the 260 MB limit for gpx files).
2. Convert the gpx files to geojson, and then combine the geojson files into a single file. Mapbox has already created these tools using nodejs.
If you’re using MacOS, the following commands will work fine. If you’re on Windows, this is a good opportunity to try the recently-released bash on Windows.Once we’re in bash, we’ll install our packages using apt (previously apt-get):
sudo apt install npm
sudo apt install nodejs
npm install -g @mapbox/togeojson
npm install -g @mapbox/geojson-merge
Acquire the gpx files you’d like to visualize and place them somewhere such as
C:\rides
If you’re using bash on windows, you can access that directory via:
cd /mnt/c/rides
Now convert the gpx files type (this might take a couple minutes):
for file in *.gpx; do togeojson "$file" > "$file".geojson; done
To combine all the geojson files into a single geojson file:
geojson-merge *.geojson > combined.geojson
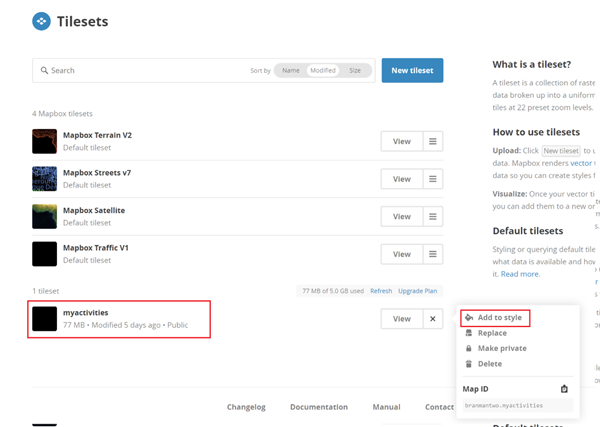
3. Upload the combined.geojson file to create a tileset. We’ll need a Mapbox account for this (don’t worry, it’s free!).
This will process the geojson file and create a vector tileset. Once processed, we can add this tileset to a new style.
Note: This can all be accomplished by the great API Mapbox provideds, including a nice Mapbox CLI.
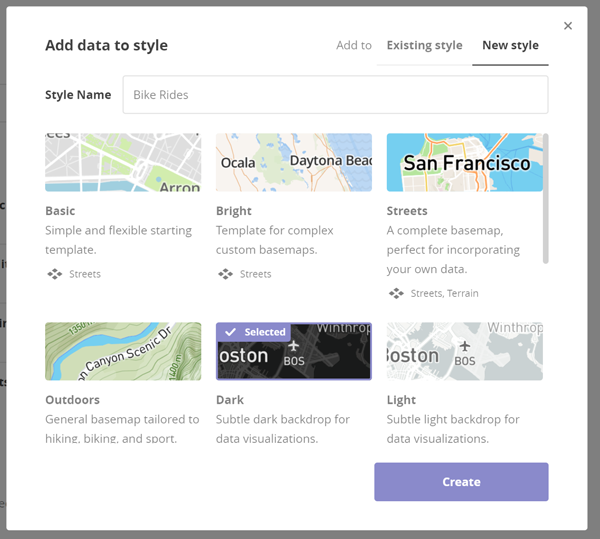
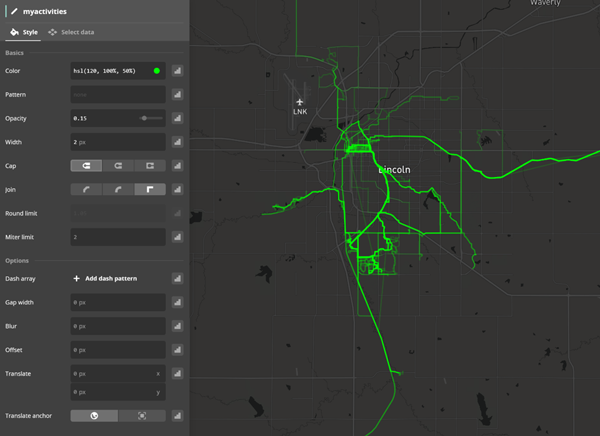
4. Once the style is created, we can add a myactivities layer to our style.
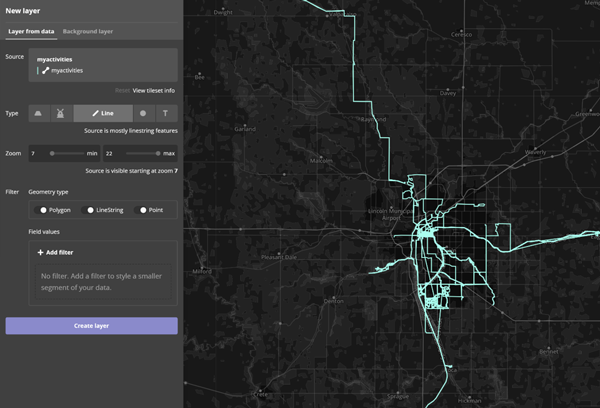
5. Now we can edit how the map will look by customizing things like the color, thickness, visibility, and opacity of our layers. I choose a green semi-transparent color so it looks like a heatmap.
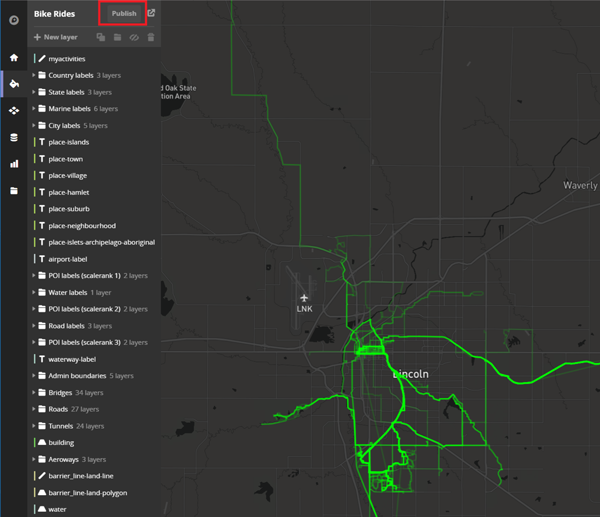
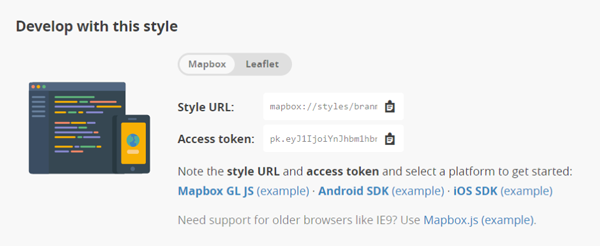
6. After we’re finished editing the map, we click Publish to save the style and make it available to be consumed in your web or mobile application. The example code makes it very easy to get started. Simply paste in your style and public access token and you have a beautiful interactive map.
That’s pretty much it. Mapbox equips you with the tools to create custom maps with very little effort. The amount of customization you can do is pretty mind blowing. Check out some of the samples in their gallery to get an idea of how powerful Mapbox can be or if you’re looking for inspiration.
What ways have you used Mapbox to build custom maps? Share your stories in the comments section below.