
Debugging LINQ
LINQ is awesome! It allows you to write very concise and easy to understand queries. However, it also hides the actual queries, which can make debugging a bit more difficult. I recently experienced this firsthand when I had to debug a LINQ statement that I didn’t write. But the silver lining was that I found two methods to debug LINQ, and both are very useful.
Logging
If you need to look at the query during development, you can define a logger in your DbContext instance or constructor of your base DatabaseContext class.
 public DatabaseContext() : base("ApplicationServices")
  {
      this.Database.Log = (s => Debug.WriteLine(s));
  }
This will dump the actual SQL query to the debug window. In this example, it will turn this:
var query = from ulpl in db.PointsLeaderboard
             join clpl in db.PointsLeaderboard on ulpl.CompanyId equals clpl.CompanyId into clpl where ulpl.UserId == userId
  select new DataContracts.Composite.UserLeaderboardRank
   {
    UserRank = ulpl.Rank,
     LeaderboardCount = clpl.Max(r => r.Rank)
   };
 return query.FirstOrDefault();
into this:
SELECT
    [Limit1].[Rank] AS [Rank],
    [Limit1].[C1] AS [C1]
    FROM ( SELECT TOP (1)
        [Project1].[Rank] AS [Rank],
        [Project1].[C1] AS [C1]
        FROM ( SELECT
            [Extent1].[Rank] AS [Rank],
            (SELECT
                MAX([Extent2].[Rank]) AS [A1]
                FROM [dbo].[PointsLeaderboard] AS [Extent2]
                WHERE [Extent1].[CompanyId] = [Extent2].[CompanyId]) AS [C1]
            FROM [dbo].[PointsLeaderboard] AS [Extent1]
            WHERE [Extent1].[UserId] = @p__linq__0
        ) AS [Project1]
    ) AS [Limit1]
As you can see, LINQ sometimes creates a crazy mess.
You might decide to modify the LINQ or copy paste the SQL to SQL Management Studio to look at the query plan to see why things are slow, or break it up to see why the query is not returning what you expected.
SQL Server Profiler
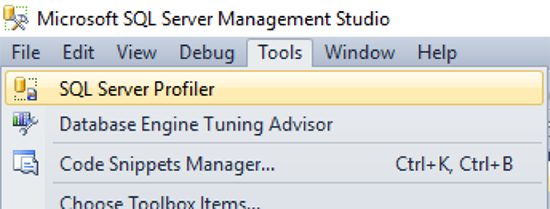
If everything works fine during development, but something goes wrong in production or on a staging server where you don’t have an easy way to debug, then you can use SQL Server Profiler. Launch it from the Tools menu of SQL Server Management Studio.
Connect to the SQL Server where the query to be debugged is located.
I take all the defaults, and here we are in the profiler window.
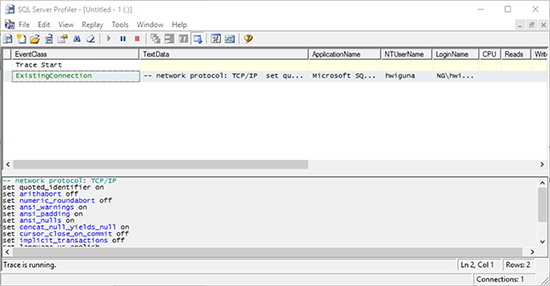
Hit the Stop button, set up the scenario on your app to occur just before it executes the query in question. Hit the Start button and watch the profile window capture your queries.
Select the problematic query and copy it into SQL Management studio to experiment and debug.
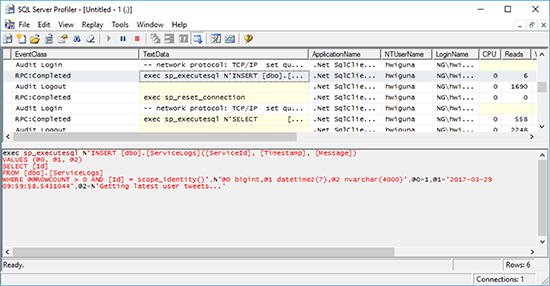
You will probably need to massage the captured query in order to debug it in SQL Management Studio, but when you could not duplicate the issue on your machine, being able to see the actual problematic query and parameters is invaluable.
-- ',N'@0 bigint,@1 datetime2(7),@2 nvarchar(4000)',
 declare @0 bigint
 declare @1 datetime2(7)
 declare @2 nvarchar(4000)

-- @0=1,@1='2017-03-29 09:59:58.5431044',@2=N'Getting latest user tweets...'
 set @0=1
 set @1='2017-03-29 09:59:58.5431044'
 set @2=N'Getting latest user tweets...'

-- exec sp_executesql N'
 INSERT [dbo].[ServiceLogs]([ServiceId], [Timestamp], [Message])
 VALUES (@0, @1, @2)
 SELECT [Id]
 FROM [dbo].[ServiceLogs]
 WHERE @@ROWCOUNT > 0 AND [Id] = scope_identity()
Hopefully you find these methods helpful. Happy debugging!